Most brands set an ecommerce marketing budget as a percentage of revenue, which answers a finance question when the real one is about operations. What you can spend well is capped by what the business can absorb: inventory on hand, orders you can pick and ship, customers you can answer, creative you can produce. Your budget rarely runs out before one of those four does.
So the useful version of the question is narrower than the one people ask. Which part of your operation breaks first if demand doubles next month and what would it cost to raise that limit? Answer that and the percentage takes care of itself.
Your Ecommerce Marketing Budget as a Percentage of Revenue Is Where the Question Starts, Not Where It Ends
Starting with a percentage of revenue is a reasonable instinct and I’d rather you start there than nowhere. It gives you a bounded number to argue with instead of a blank page. It just can’t be the last step, because the percentage describes what companies spent rather than what your operation could have converted.
The most-cited benchmark comes from Gartner’s annual CMO survey. In Gartner’s 2025 CMO Spend Survey, marketing budgets came in at 7.7% of company revenue, flat against the prior year, with half of the CMOs surveyed reporting 6% or less. If you’ve been told 10% is the standard, that’s your first correction: the middle of the market sits below it.
Where the published benchmarks come from and what they assume about your operation
Read the methodology before you use the number. Gartner’s 2025 figure comes from about 400 marketing leaders in North America, the UK and Europe, and the large majority run companies above $1 billion in revenue. Those businesses have inventory financing, warehouse capacity and in-house creative teams that a brand doing $8 million does not.
Their 7.7% is spend they could absorb. Yours has to be spend you can absorb, which is a different number reached a different way.
It’s also why the general “how much should a small business spend on marketing” guidance you find, usually somewhere between 5% and 12% of revenue, ranges so widely. It’s averaging across businesses with wildly different capacity. Any published average marketing spend for DTC brands has the same problem: one number flattens a made-to-order brand and a stocked-deep one.
Two brands at the same revenue can afford very different spend
Take two brands doing $10 million. One sells a made-to-order product with a six-week lead time, one warehouse and a two-person support team. The other holds 90 days of stock on its top sellers, ships from two nodes and staffs a service desk twelve hours a day.
The second brand can put meaningfully more into paid acquisition and still deliver what it sells. Same revenue, same category, different ceiling. That’s why how the budget gets allocated across the whole plan matters more than which percentage you picked. It’s also why the number should be built from your current state before it’s compared to anyone else’s.
Effective Spend Is Capped by What Your Operation Can Absorb
Effective marketing spend is the amount you can put into demand generation and still convert, ship and service the resulting orders at your normal quality. Past that point you’re buying demand you handle badly, which costs twice: once in media and again in refunds, churn and the reviews that follow.
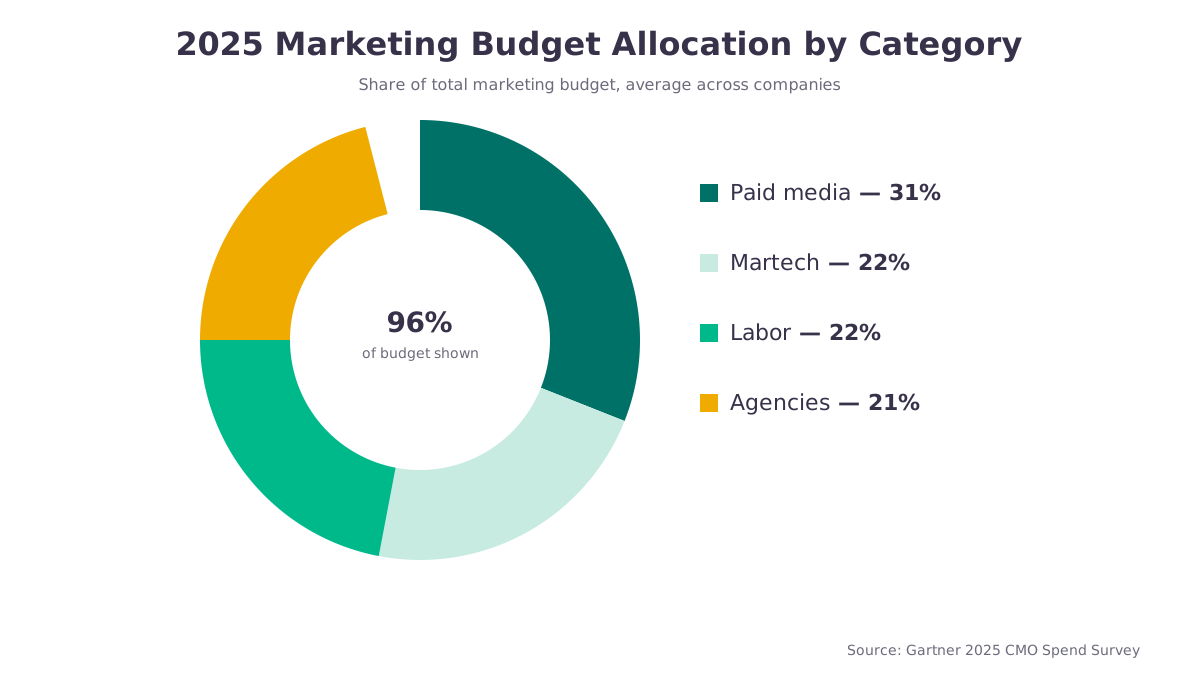
In Gartner’s 2025 breakdown, paid media took 31% of the average marketing budget, with martech at 22%, labor at 22% and agencies at 21%. Roughly two-thirds of the money buys the capacity to run marketing rather than the media itself, which is the first clue that “spend more” and “advertise more” were never the same decision.
The four ceilings: inventory, fulfillment, customer service, creative throughput
Four constraints cap most consumer brands and they arrive in a fairly predictable order as spend climbs.
| Ceiling | The signal you’ve hit it | What tends to raise it |
|---|---|---|
| Inventory | Best sellers stock out mid-campaign; ads keep running on products you can’t ship | A longer buying horizon, safety stock on top sellers, inventory financing |
| Fulfillment | Order-to-ship time slips past your promise; peak-day error rates climb | More pick-and-pack labor, a second node or 3PL, better slotting and packaging |
| Customer service | First-response time slips; “where is my order” and refund tickets grow faster than orders do | Wider coverage hours, saved replies for your top ticket types, self-serve tracking |
| Creative throughput | Frequency climbs while click-through falls; the same three assets carry all the spend | A steadier production cadence, a wider concept pipeline, faster editing turnaround |
Spending past the lowest ceiling buys demand you convert badly or serve badly
Your effective ceiling is set by whichever of the four sits lowest, not by the average of them. A brand with beautiful creative capacity and eleven days of stock is an eleven-days-of-stock brand the moment spend rises.
The constraint that decides your marketing budget is usually the one nobody in the marketing meeting owns.
Inventory Is the First Ceiling Most Growing Brands Hit
Inventory is where a spend increase turns into a balance-sheet decision. Money behind a campaign is recoverable in weeks; money behind a seasonal buy is committed for months and a wrong buy consumes the cash that funds everything else.
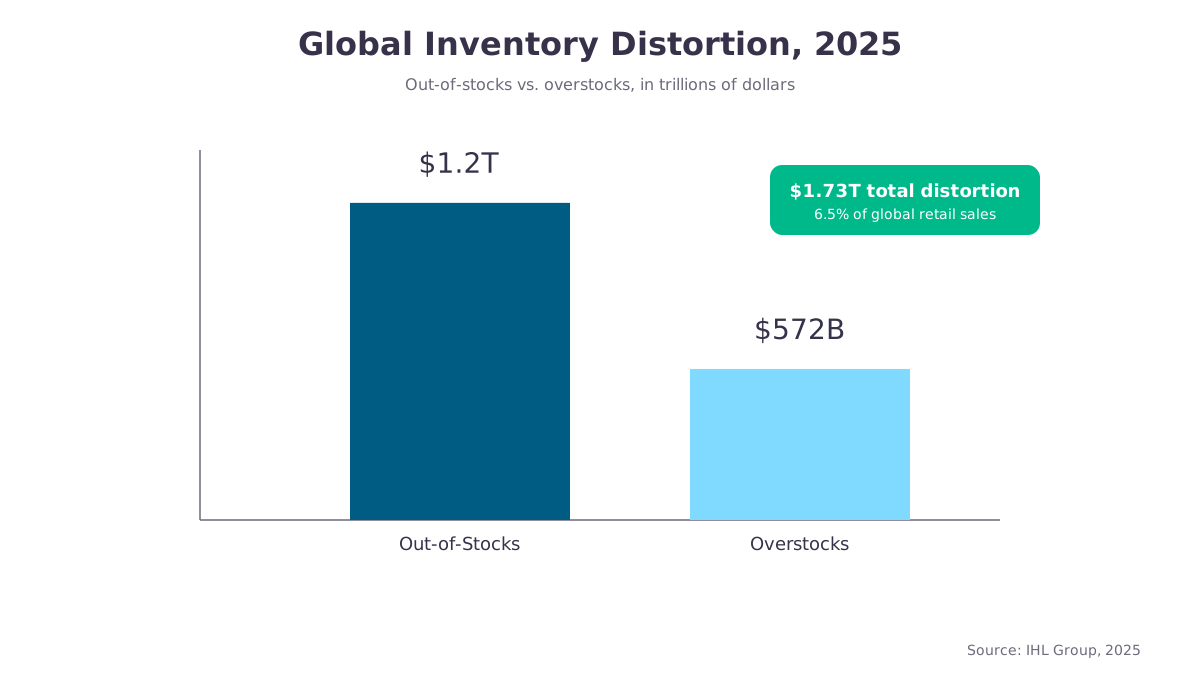
The scale of that problem across retail isn’t small. IHL Group’s 2025 research puts global inventory distortion at $1.73 trillion a year, about 6.5% of global retail sales, split between roughly $1.2 trillion in out-of-stocks and $572 billion in overstocks. Read that against the 7.7% of revenue the average company spends on marketing: the industry loses nearly as much to holding the wrong stock as it spends on demand generation.
I had a client doing $15 to $20 million a year online who made one bad seasonal inventory buy and it flipped her from a profitable year to a $1.5 million loss. She spent the next three months personally negotiating with banks to keep the business open, down to the last night before the final bank approved the final piece of financing. No media plan would have rescued that quarter, because the constraint was never demand.
Before you raise spend on a product line, look at what your inventory position can support at the new volume, measured in weeks of cover rather than units on hand. Under about six weeks of cover on your top sellers, more spend tends to buy stockouts.
If you can’t tell which product line would run dry first at double the spend, an outside read on your ceilings is usually faster than another quarter of guessing.
Fulfillment and Service Costs Arrive Before the Revenue Does
Fulfillment and service scale with orders rather than with net revenue, so both bills land before the money is safely yours. Returns are the clearest example and online returns run materially higher than store returns.
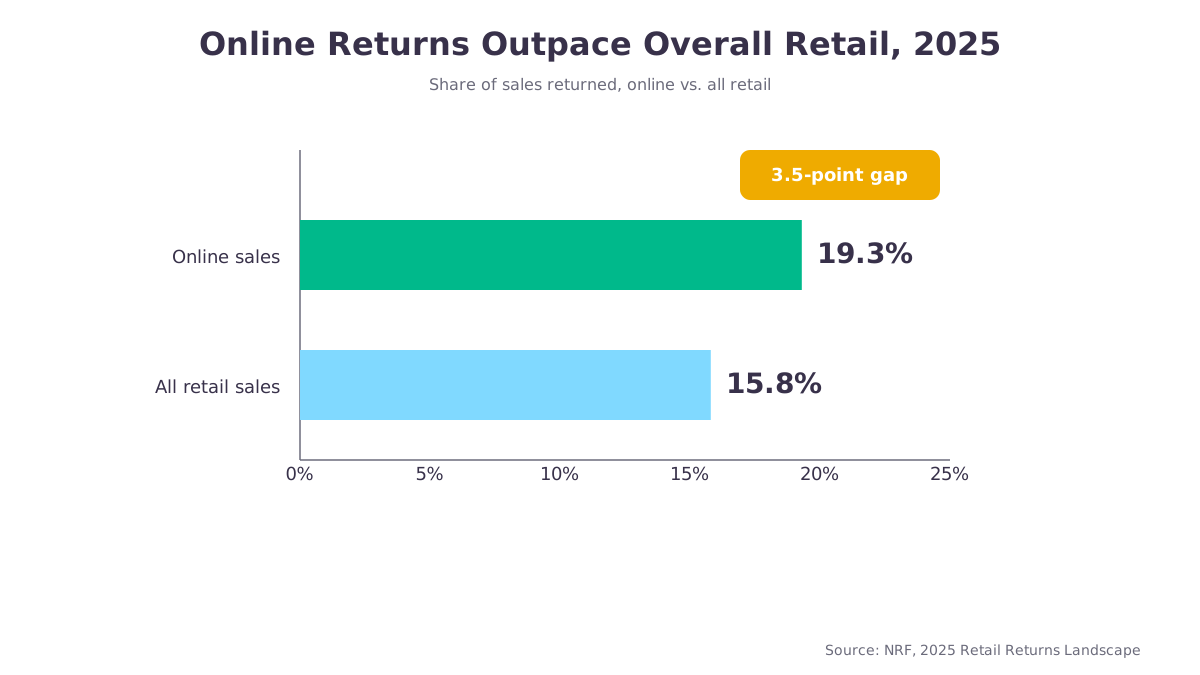
The National Retail Federation’s 2025 returns report put total US returns near $850 billion, with 15.8% of all retail sales returned and 19.3% of online sales returned. For your model that means roughly one in five ecommerce orders comes back, so every added dollar of ad spend has to clear the acquisition cost plus the round-trip shipping and processing on the fifth of it that doesn’t stick.
Service capacity fails more quietly. Response times slip a few hours, refund requests age, and the damage surfaces six weeks later in repeat rate and review scores rather than in this month’s dashboard. If your support queue already runs a day behind, a spend increase makes it two.
Creative Throughput Runs Out Sooner Than Media Budget Does
Creative is the ceiling most teams discover last, because nothing breaks visibly. The ads keep serving. Frequency climbs, click-through drifts down, cost per acquisition rises, and the platform reports all of it as an auction problem rather than a supply problem.
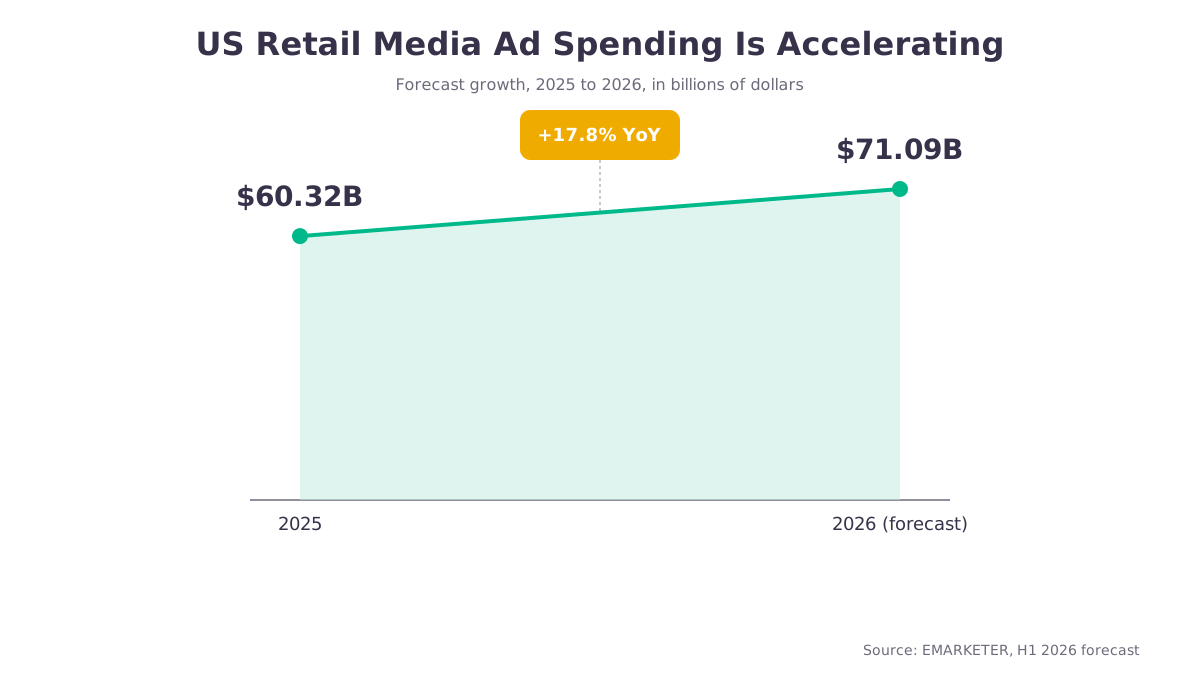
Auction pressure is real and getting worse. EMARKETER’s H1 2026 retail media forecast has US retail media spending rising from $60.32 billion in 2025 to $71.09 billion in 2026, growth of 17.8% in a year and faster than either search or social. More money chasing the same inventory means your digital marketing costs climb whether or not your creative improved, so the brands holding their efficiency are the ones feeding fresh concepts into the auction rather than more dollars.
When I go into a stalled paid account, creative is the ceiling nobody has looked at yet. A practical test: count how many distinct concepts, not variations, carried 80% of your spend last month. If the answer is one or two, your media budget already outruns your creative supply and more spend will mostly buy frequency.
Find Which Ceiling You Hit First Before You Set the Number
You can calculate an ecommerce marketing budget from your own operation in an afternoon using data you already have. The goal isn’t a perfect model: it’s locating which constraint binds first so the budget conversation has a subject.
A read of your own operation you can do this week
- Pick your growth scenario. Take your last full month of orders and ask what a 50% increase would look like next month. Not a doubling, which nobody believes, and not 10%, which nothing breaks at.
- Run each ceiling against it. Weeks of cover on your top ten SKUs at the new order rate, orders per day fulfillment handles before ship time slips, tickets your team clears at current staffing, creative concepts you can ship per month.
- Note the first one that fails and by how much. One will fail earlier and harder than the others. That’s your binding constraint and it’s what the budget is actually about.
- Price the fix. Ask what raising that one ceiling costs, in dollars and in weeks. That figure belongs in the budget conversation even though it won’t feel like marketing spend.
What the answer tends to look like at each end of the spectrum
At the low end sit brands with long lead times, thin cash, one fulfillment point and a founder still writing the ads. They often land in the low-to-mid single digits as a percentage of revenue and pushing past it tends to buy stockouts rather than growth.
At the high end sit brands with stock depth, a service team, a working creative pipeline and a repeat purchase that pays back inside a quarter. They can run in the teens or higher and some launch-stage brands deliberately run well above that for a defined period because they’re buying a customer base rather than this quarter’s margin.
Most brands I see live between those poles and move along the range as capacity changes, instead of picking a number and holding it.
Blended MER Tells You Whether the Spend Is Working; Platform ROAS Tells You What the Platform Wants You to See
Marketing efficiency ratio, or MER, is total revenue divided by total marketing spend across every channel in the same period. It’s a blunt instrument and that’s the point: attribution can’t inflate it, because both numbers come off statements rather than off a platform’s own report card.
Blended ROAS is the same calculation under a different name; use whichever term your team already uses. There’s no single marketing efficiency ratio benchmark that holds across ecommerce either. A 90-day payback business and a one-purchase business can post the same MER and be in completely different health.
Platform ROAS answers a narrower question: how one platform grades the conversions it believes it caused. Both numbers can be true at once and the gap between them usually lives in overlapping attribution windows. If platform ROAS climbs while MER stays flat, you’re likely paying for demand you already had.
Use MER as the ceiling gauge and platform ROAS as the steering wheel. Neither tells you whether the operation can ship what the ads sold, which is why the metrics that show it’s working should include ship time and first-response time alongside the media numbers.
Contribution Margin and Payback Period Set the Outer Limit on What You Can Afford
Contribution margin is what’s left from an order after the variable costs of making it, shipping it, processing payment and servicing it. It’s the money available to cover acquisition and overhead and it’s the honest denominator for any spend decision.
Two brands with identical revenue and identical customer acquisition costs can have completely different room to spend, purely because one keeps 55 cents of the sale and the other keeps 28 cents. Before arguing about percentages, know what each order actually contributes once returns and shipping subsidies are in the math.
Why a high LTV earns you room and why payback decides whether you can use it
Lifetime value earns you permission to spend more per customer, which is what the customer acquisition cost to lifetime value ratio in ecommerce is really measuring. Payback period, the number of months until a new customer’s cumulative contribution covers what you paid to acquire them, decides whether you can act on that permission without financing it.
A brand with a two-year LTV and a nine-month payback is solvent on paper and cash-poor in practice, which is the trap that catches fast-growing DTC launches. The tighter your cash position, the more the payback window rather than the LTV should govern the budget.
The 70/20/10 Split Is About Protecting the Core While You Test
The 70/20/10 rule is a marketing budget allocation shape: about 70% to proven channels, 20% to promising ones being scaled and 10% to genuine experiments. It’s less a formula than a way of protecting the experiment budget from a bad month, since the 10% is the first thing most teams cut under pressure.
Treat the ratios as a starting shape rather than a law. Launch-stage brands with no proven channel yet can’t have a 70 and mature brands with one dominant channel often run closer to 80/15/5 on purpose. What travels across every version is the principle: name the money that’s allowed to fail before the quarter starts or it quietly gets spent on what already works.
Test New Channels on a Fixed Window With the Kill Number Written Down First
The 3-3-3 rule circulating in marketing forums usually means giving a new channel three months, three creative concepts and a small fixed share of budget before judging it. The instinct is sound and the numbers are arbitrary: a rule that fits email won’t hold for a channel with a two-week learning phase.
The honest version is a bounded test with three things agreed in writing before the money moves: the window, the metric, and the number at which you stop. Windows tend to run six to twelve weeks for paid social and longer where the purchase cycle is delayed. What makes the test valid is writing the stop condition down while you’re still calm.
If you’re in the middle of a test you can’t tell is working, a working call on your actual numbers will usually settle it faster than another four weeks of data.
Raise the Ceiling Before You Raise the Budget
When the read above points at a constraint, capacity spending beats media spending for that quarter. A fulfillment node, a service hire, a photographer on retainer or a week of supplier lead-time work each raise the demand you can profitably serve, which raises the number the marketing budget is allowed to be. Our guides for owners cover this in more depth when the ceiling you hit isn’t the one you expected.
In-N-Out is the clearest public example of a company choosing its own ceiling. Founded in 1948 by Harry and Esther Snyder, it has kept an essentially fixed core menu for more than 75 years, stayed private and non-franchised, and expanded regionally on purpose. As CNBC reported in November 2024, its commitment to never freezing ingredients means every restaurant has to sit within a day’s drive of a supply center, which caps how fast it can open stores.
A constraint you chose and planned around is a strategy. A constraint you discovered mid-campaign is an incident.
Most brands can’t make that trade so absolutely. The transferable part is the sequence: decide what the operation will be excellent at, build the capacity to hold that promise at the next volume, then buy demand against it. That sequencing judgment is most of what an ecommerce marketing consultant brings to an ecommerce growth strategy. It outlasts any particular budget.
What to Expect as the Number Moves
Your percentage will move and the movement is information rather than a mistake. Seasonality alone can swing it by several points, since a brand doing 40% of its year in the fourth quarter spends against inventory it bought in July.
Expect the honest answer to stay a range with conditions attached and expect that range to narrow as you accumulate your own data. A brand with two years of cohort history can talk about payback in weeks; a brand in its first DTC year is working from a supplier’s lead time and a guess, so it should hold a wider band and revisit it monthly.
The number also moves when the operation does. Every time you raise a ceiling you earn room to spend more, so the useful habit is to plan the capacity build on the same calendar as the spend increase rather than a quarter behind it.